Address of this service: http://mcgb.uestc.edu.cn/b2dsc
1. Enter sequence(s), select blast database(s), set parameters and finally submit.
(1) On the Home page, enter your DNA sequence in the textarea.
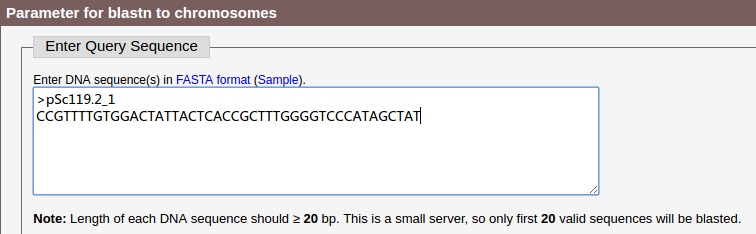
The sequence should be in FASTA format, and no less than 10 bp. We take probe sequence pSc119.2_1 as an example here.
(2) Set blast databases to align against.
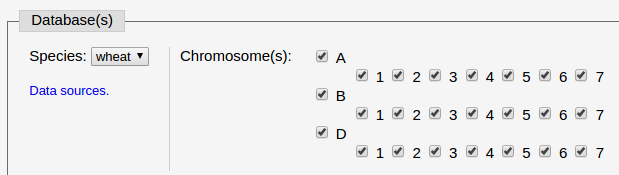
In this example, we select wheat and all the 21 chromosomes to blast against.
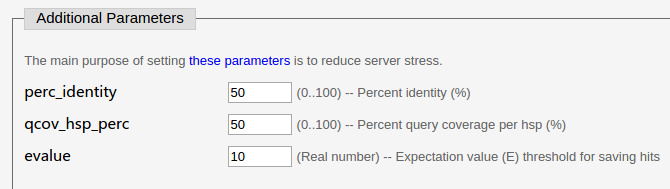
For the other parameters (Additional Parameters), here we use the default ones. Set perc_identity and qcov_hsp_perc to 0 if you do not want to discard any HSP (High-scoring Segment Pair).
(3) The Parameters for similar sequences module.
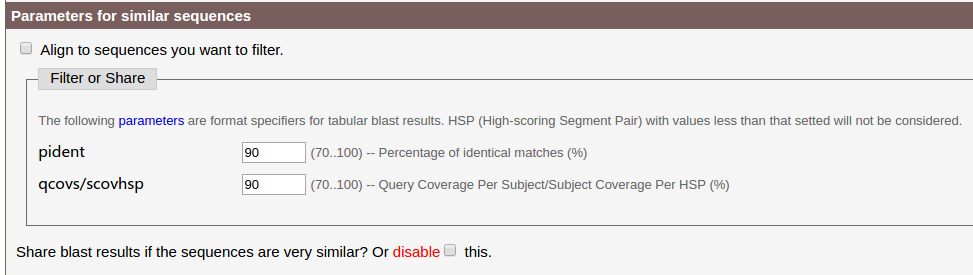
- The query sequence may be highly similar to known probes stored in this server.
- There may be sequences similar to each other in the query sequences.
- You may want to filter some kind of sequence out from your query sequences.
Ralated parameters should be set here.
By default, the server will first run bl2seq for the query sequences, then run bl2seq between query sequences and known probes, based on those two parameters shown in the image above. Sequences highly similar to each other will share the same blast result.
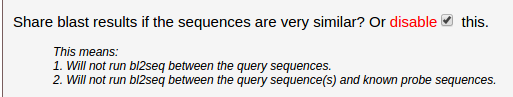
If you want to align each sequence to chromosomes directly, please check disable. Here we check this checkbox, because results of pSc119.2_1 was store in the server and by default the results will be used directly, we check this to run it again.
If you have already analysed some sequence, and want to filter simlilar sequences of it out from your query sequences, please check Align to sequences you want to filter, then enter your sequence into the textarea. Sequence should be in FASTA format, no less than 10 bp.
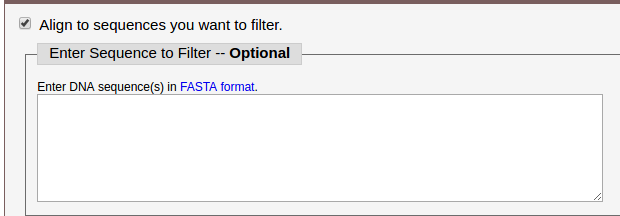
We do not filter any sequence out in this example.
(4) Submit the job by click 'BLASTN'.
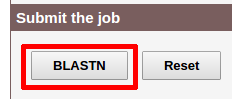
Then the page will jump to the Job status page.
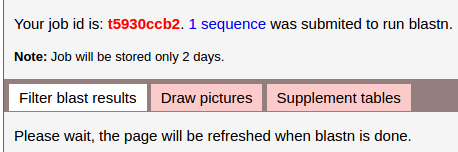
The page will refresh automatically until the task is done.
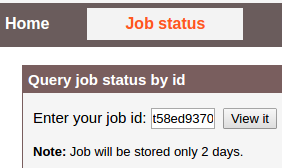
You can view the job later by 'job id' (red bold), it is t5930ccb2 in this example. Visit Job status, enter job id to query your job, and do more.
The genome of wheat is quite big, and this server is on a simple PC, so if the sequence is highly repeated, blastn may take a long time, several minitues for example.
2. Filter blast results.
It will like this when blastn is done.
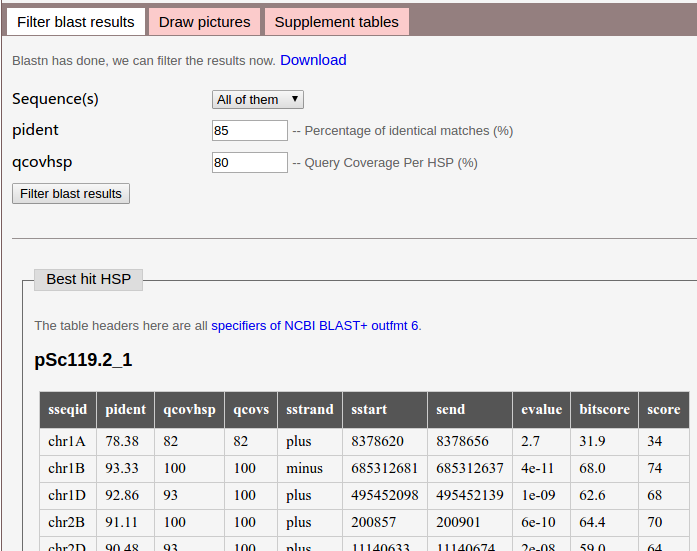
The top half of this image showns parameters you can set. You can select one sequence a time or filter them all, pident and qcovhsp can not out of range for each of them (or All of them).
The lower half of the image shows best hit HSP for the query sequence, this could be a reference for us to set parameters.
If you want to see the blast results, click Download.
We use default values here, and click Filter blast results button to submit.
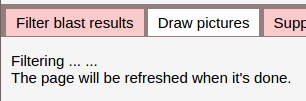
3. Draw picture.
Filtering may take several seconds, when finished, the page will like this:
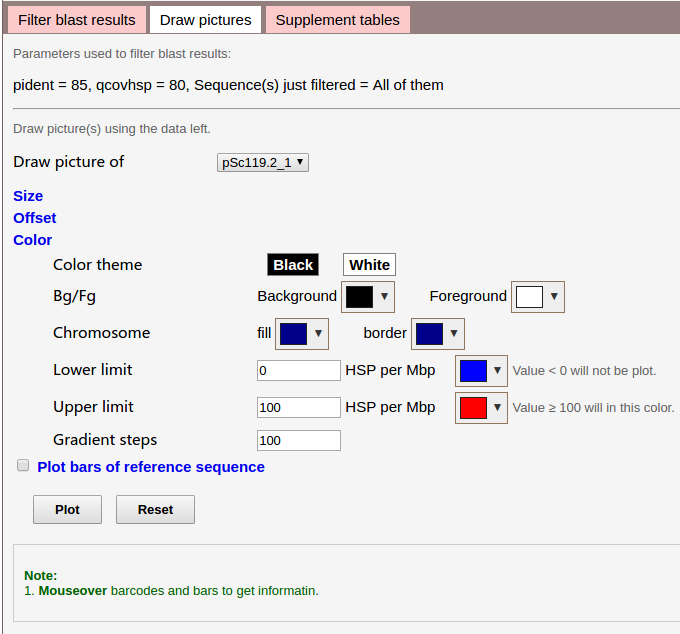
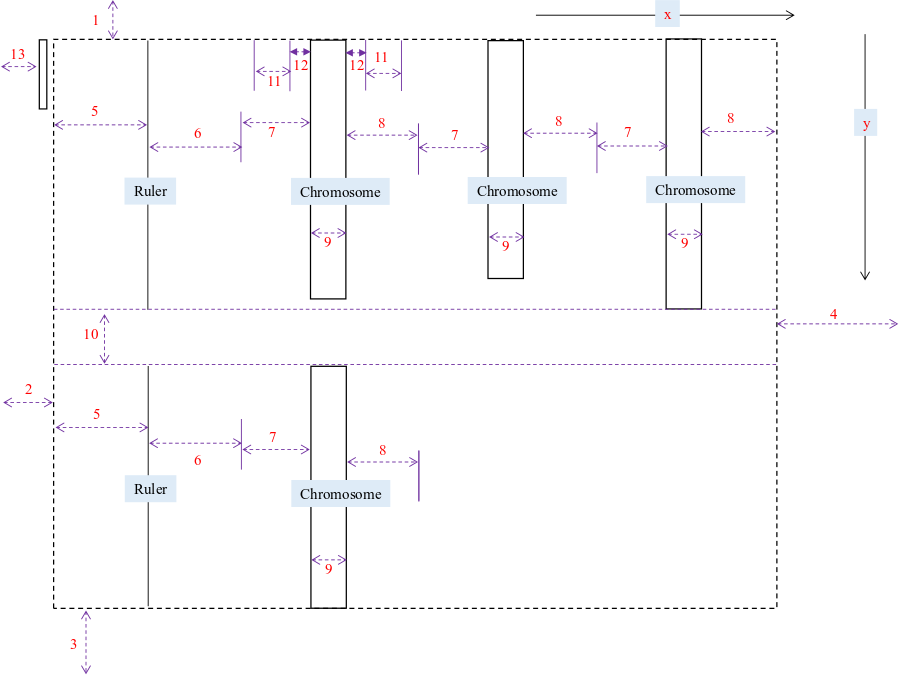
Parameters for plot:
- Size: margins of the whole image, blank width on left/right side of the ruler, width of each chromosome, and so on.
- Offset: offsets of tick labels (e.g. set a negative integer for x to move left), chromosome names, and so on.
- Color: colors to fill each chromosome, border of each chromosome. Color for lower limit, upper limit, and gradient steps.
- Plot bars of reference sequence: plot distribution of the reference sequence, it is CCS1 for wheat. By default, in a kind of grey color, no gradients, the color is customizable.
Here we check Plot bars of reference sequence, and use default parameters.
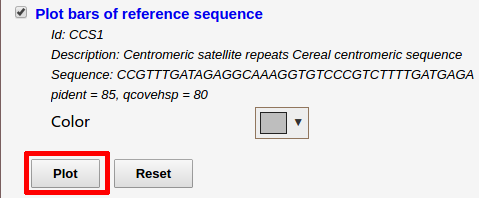
Click Plot to plot.
- Iamge is plot by JavaScript program, so it will cost some of user's PC resource.
- Beacause the image is in SVG format, so please use a modern web browser, such as Chrome/Firefox or IE11+/Edge, other modern browser may works too.
Finally, we can see the result picture
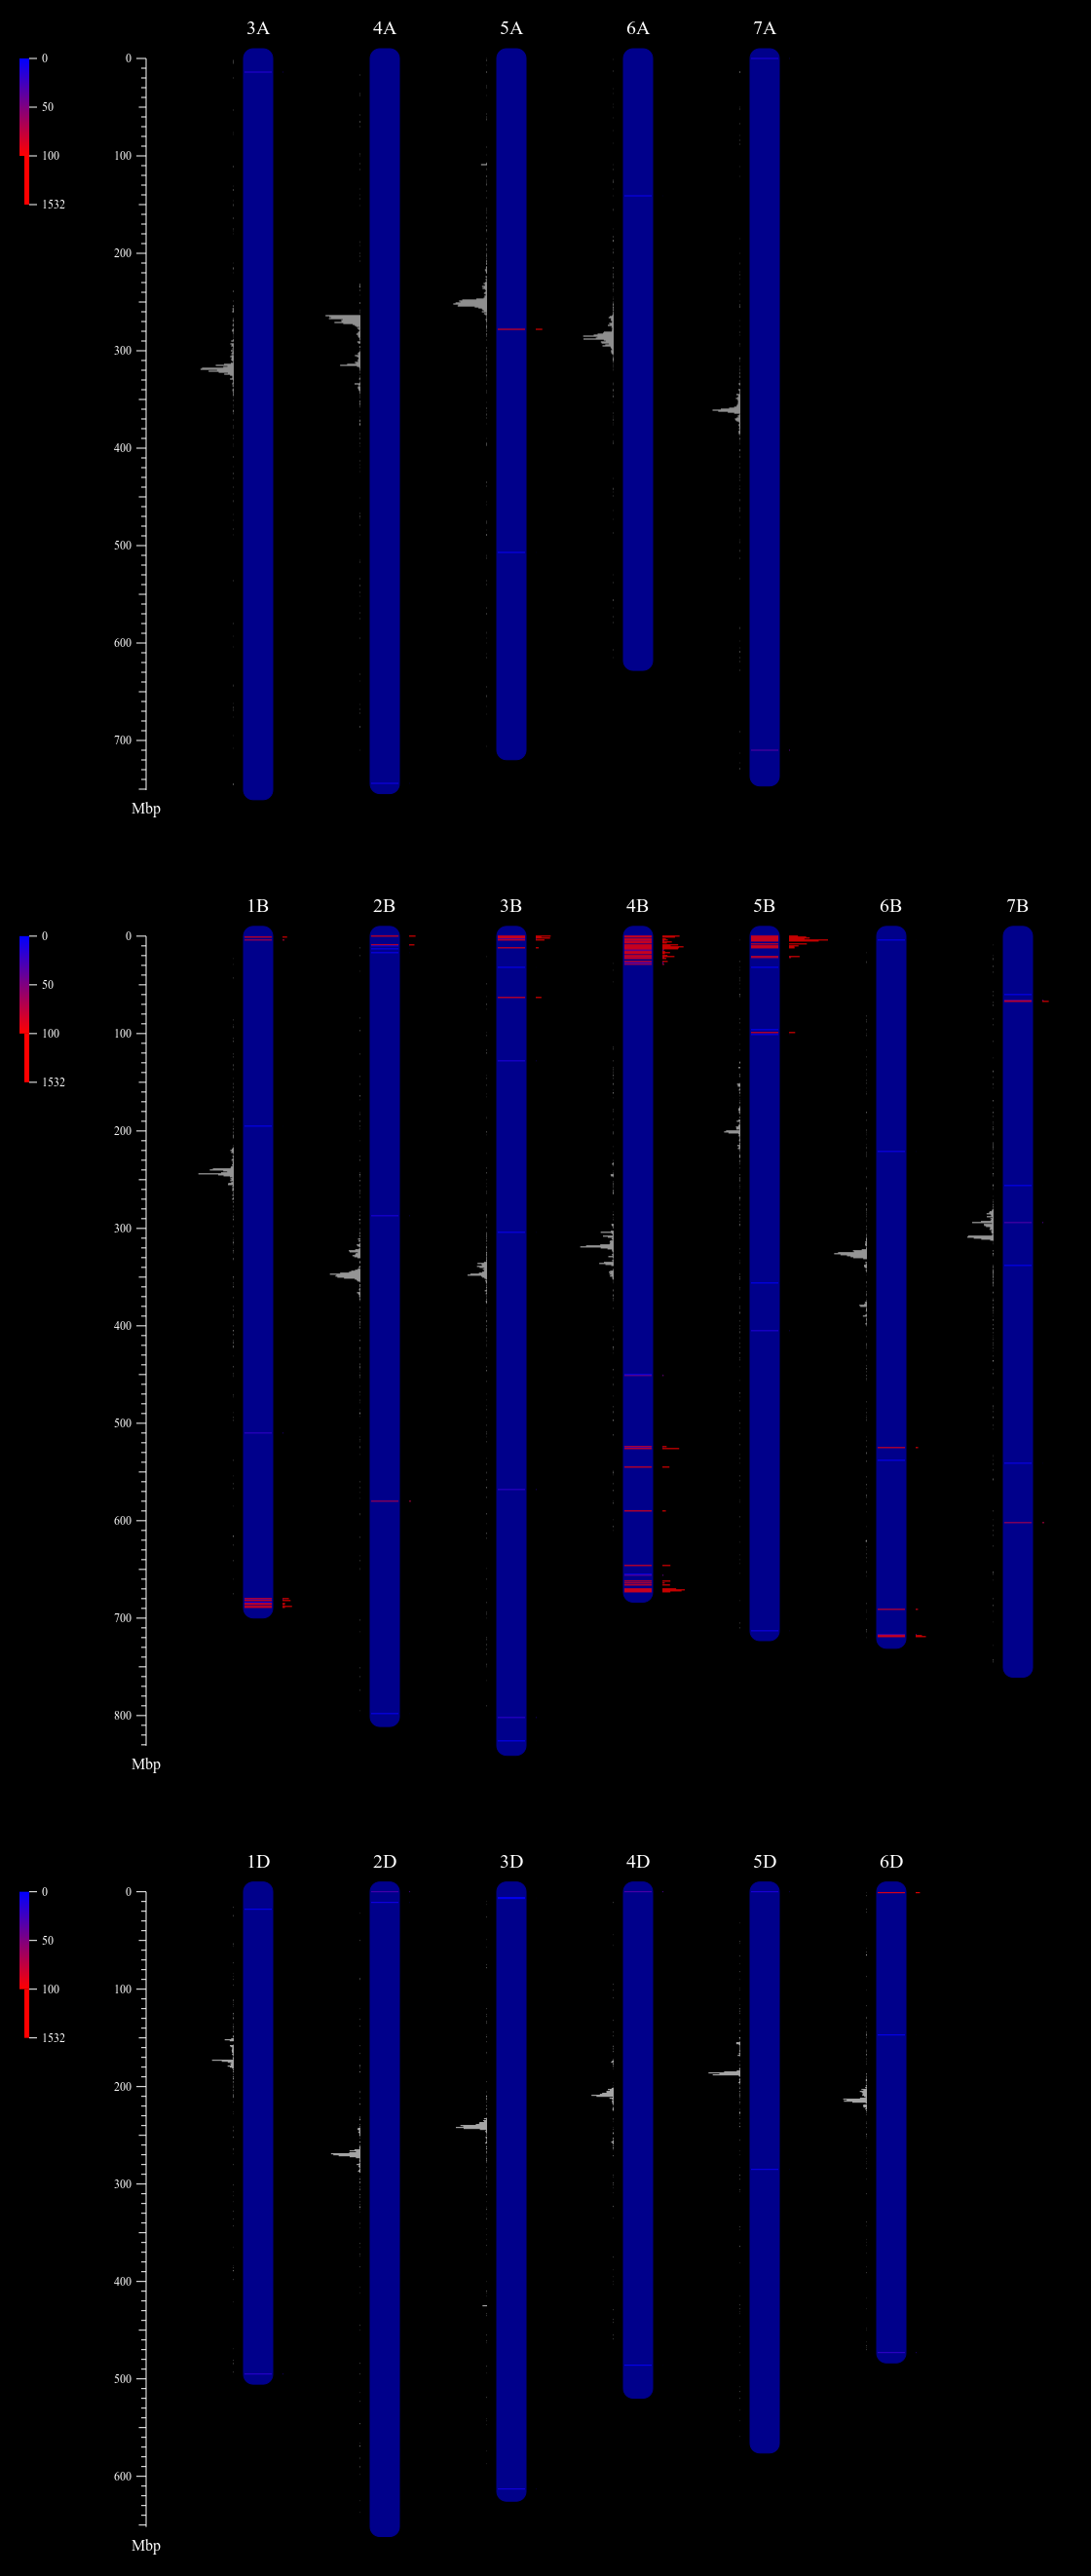
Only those chromosomes hit with HSP meet the criteria were plot. Bar plot for CCS1 in the left of each chromosome shows the approximate position of centromere. The more red the line in each chromosome is, the more repeats in 1 Mbp it has, and bar is longer.
We can see that pSc119.2_1 distributed in B genome is much more than that in A and D genomes.
In the real plot result (not the image in this help), move your mouse over a line in one chromosome or a bar on both sides, and you can get some information of repeats in the range. For example:
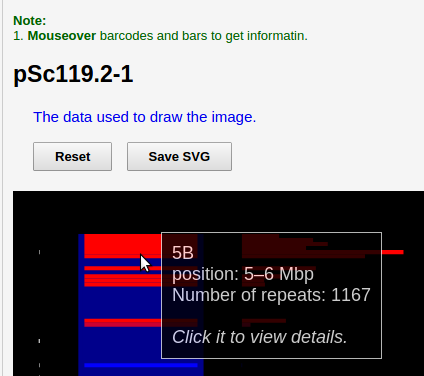
We can see it shows on 5B chromosome, in the range of 5 Mbp ~ 6Mbp, pSc119.2_1 repeated 1,167 times. Note, position starts from 0.
The image is draggable (left mouse button) and zoomable (mouse wheel), click Reset button to restore.
Click the Save SVG button to save SVG format image. SVG format images can be edit by Inkscape/Illustrator, text editor and so on.
Click red lines in the image above to see more about the sequence distribution.
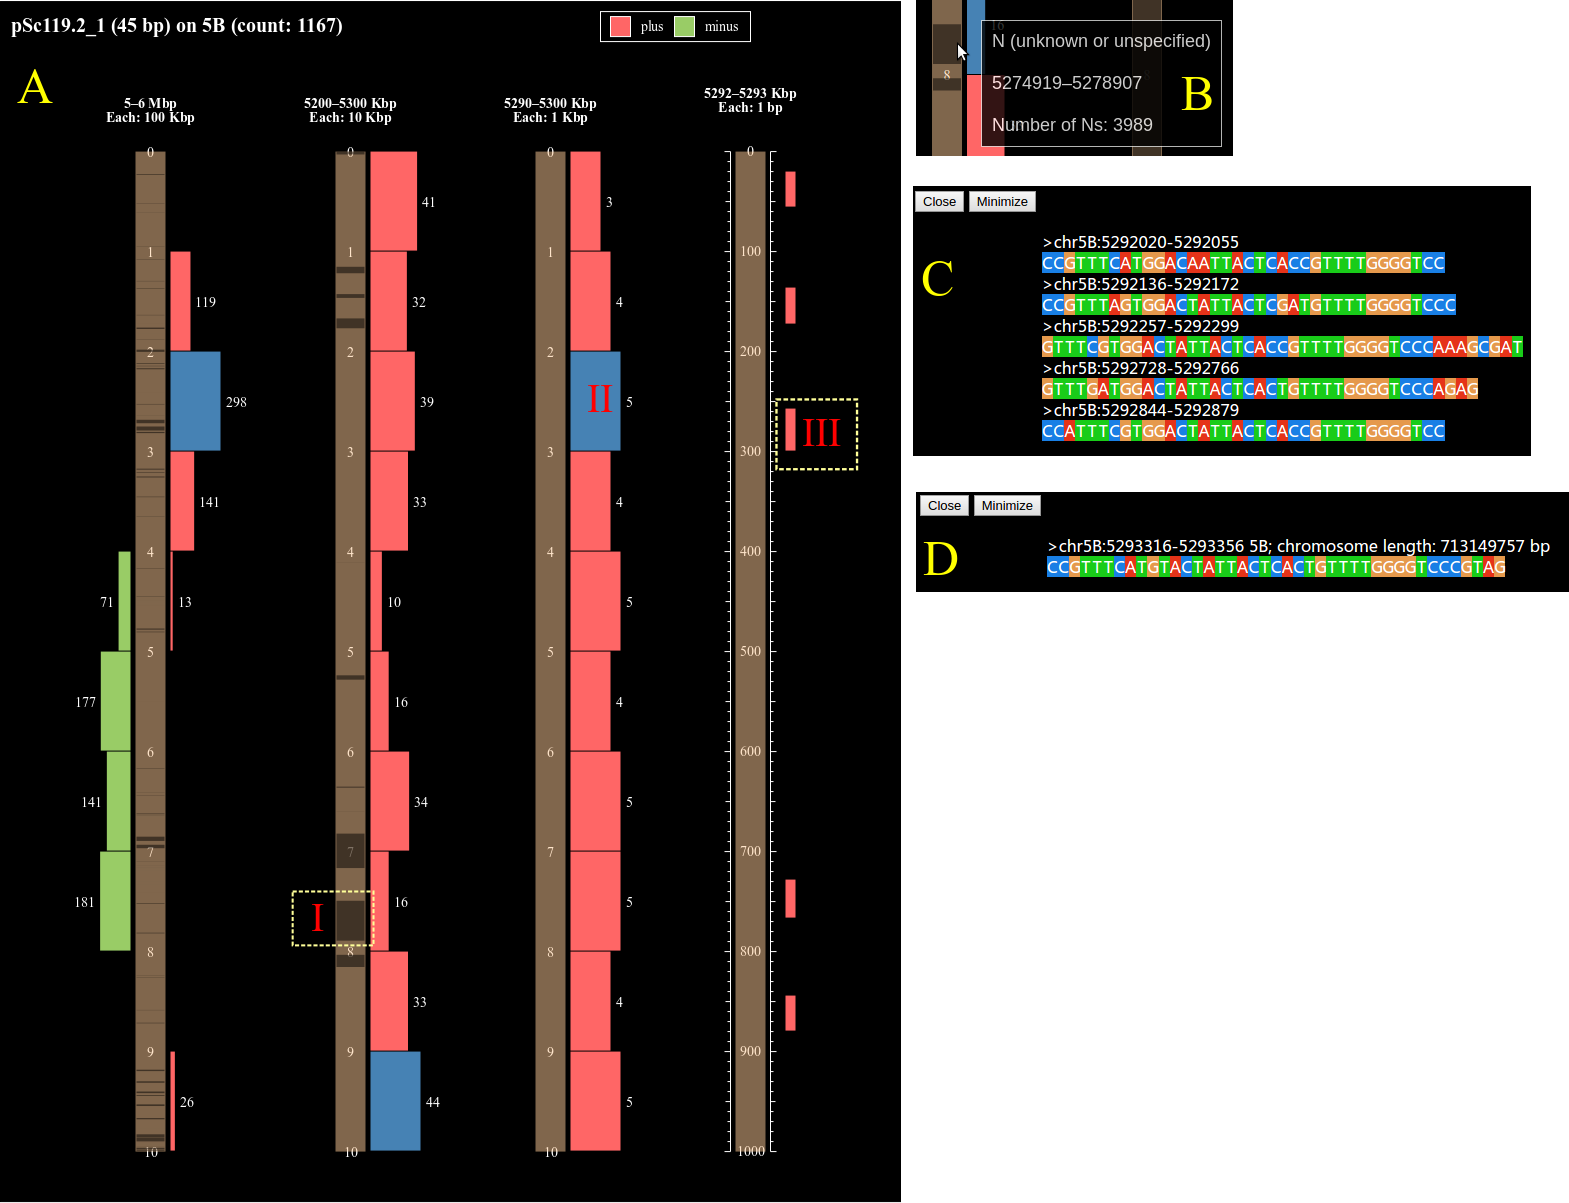
In the image above, A-I: the distribution of the 'N' (unknown or unspecified) nucleotides, mouseover it will show the start, end position and length of the region (B of the above image).
Click the red/green rectangles (A-II, III in the above image), the sequences of the HSPs in that region will be shown (C, D in the above image) if the number of HSPs is no more than 100.
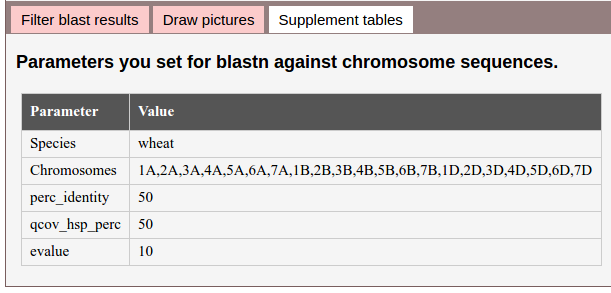
4. Supplement tables.
There may several tables generated. For example, here shows a table contain the parameters used to run blastn. Besides, it may show mapping tables of similar sequences.
If the results is not ideal, you can reset parameters each step and run again.